


The airway dataset
The methods of the previous chapter are easiest to appreciate on data where we already know what the answer should look like. We will therefore use the airway dataset of Himes et al. (2014), deposited at GEO as GSE52778.
Himes and co-workers cultured primary human airway smooth muscle (ASM) cells from four donors and treated them with dexamethasone, a synthetic glucocorticoid used to control asthma, or left them untreated. Each of the four cell lines contributes one treated and one untreated sample, so the experiment is a paired two-condition design with RNA-seq libraries. This is about as controlled as a human transcriptomics experiment gets: the only thing that differs within a pair is the drug.
It is also an experiment with a built-in positive control. Dexamethasone acts through the glucocorticoid receptor (NR3C1), a transcription factor with a well characterized set of direct target genes – FKBP5, PER1, TSC22D3 and DUSP1 among them. If our pathway analysis is working, that signal should be impossible to miss.
Notebook Cell
import importlib.util, sys
def _has(pkg): return importlib.util.find_spec(pkg) is not None
if not _has("gseapy"):
    %pip install -q "gseapy"
GEO distributes the study as a gene-level FPKM matrix with one column per library, next to annotation and per-condition summary columns. We download it once and cache it under dsbook/data/.
import os
import requests
import pandas as pd
import numpy as np
from scipy.stats import ttest_rel
import sys
IN_COLAB = 'google.colab' in sys.modules
if IN_COLAB:
    ![ ! -f "dsbook/README.md" ] && git clone https://github.com/statisticalbiotechnology/dsbook.git
    my_path = "dsbook/dsbook/common/"
else:
    my_path = "../common/"
sys.path.append(my_path) # Read local modules for qvalue calculations
import qvalue

data_dir = my_path + "../data/"
os.makedirs(data_dir, exist_ok=True)
fpkm_path = data_dir + "GSE52778_All_Sample_FPKM_Matrix.txt.gz"
fpkm_url = ("https://ftp.ncbi.nlm.nih.gov/geo/series/GSE52nnn/GSE52778/suppl/"
            "GSE52778_All_Sample_FPKM_Matrix.txt.gz")
if not os.path.exists(fpkm_path):
    print(f"Downloading {fpkm_path} ...")
    with open(fpkm_path, "wb") as fh:
        fh.write(requests.get(fpkm_url).content)

fpkm = pd.read_csv(fpkm_path, sep=r"\s+")
fpkm.iloc[:5, :6]The full series also contains cells treated with the -agonist albuterol, alone and in combination with dexamethasone. We ignore those and keep the eight libraries of the untreated/dexamethasone comparison. The library names carry the treatment, and the cell lines were sequenced in blocks of four, so LL01–LL04 come from donor N61311, LL05–LL08 from N052611, and so on. That lets us line up the samples pairwise.
untreated = ["Untreated_LL01", "Untreated_LL05", "Untreated_LL09", "Untreated_LL13"]
dex       = ["Dex_LL02",       "Dex_LL06",       "Dex_LL10",       "Dex_LL14"]

airway = fpkm.set_index("gene_id")[dex + untreated]
airway = airway[(airway >= 1.0).all(axis=1)]   # keep genes expressed in every sample
airway = np.log2(airway)
airway.shape
(10996, 8)Two remarks on that filter. First, the matrix is quantified as FPKM rather than as raw counts; FPKM is a poor basis for a count-based differential-expression model, but the -test we use below and the signal-to-noise metric that GSEA ranks the genes by are both computed from the log-transformed expression values themselves and do not assume count data, so it serves our purpose. Second, the gene-level FPKM values contain a handful of all-or-nothing artefacts, where a gene is reported at several thousand FPKM in one condition and at exactly zero in the other. Requiring at least 1 FPKM in all eight libraries removes them and leaves us with around eleven thousand robustly expressed genes.
Differential expression, dexamethasone versus untreated
Because the samples are paired by cell line, we use a paired -test rather than the two-sample test used elsewhere in this book: each gene is tested on the four within-donor differences. This removes the donor-to-donor variation, which in primary cells is substantial.
def get_significance_paired(row):
    # the columns of airway are ordered as the four dexamethasone samples
    # followed by the four untreated samples, one pair per cell line
    treated, control = row.to_numpy()[:len(dex)], row.to_numpy()[len(dex):]
    log_fold_change = treated.mean() - control.mean()
    p = ttest_rel(treated, control)[1]
    return [p, -np.log10(p), log_fold_change]

pvalues = airway.apply(get_significance_paired, axis=1, result_type="expand")
pvalues.rename(columns = {list(pvalues)[0]: 'p', list(pvalues)[1]: '-log_p', list(pvalues)[2]: 'log_FC'}, inplace = True)
np.random.seed(0)  # the pi0 bootstrap in qvalue.py draws random numbers
qvalues = qvalue.qvalues(pvalues)
A volcano plot shows a clear response: some four hundred genes move by more than a factor of two, with about twice as many going up as down.
import matplotlib.pyplot as plt
import seaborn as sns

sns.relplot(data=qvalues,x="log_FC",y="-log_p")
plt.xlabel(r"$\log_2(FC)$")
plt.ylabel(r"$-\log_{10}(p)$")
plt.show()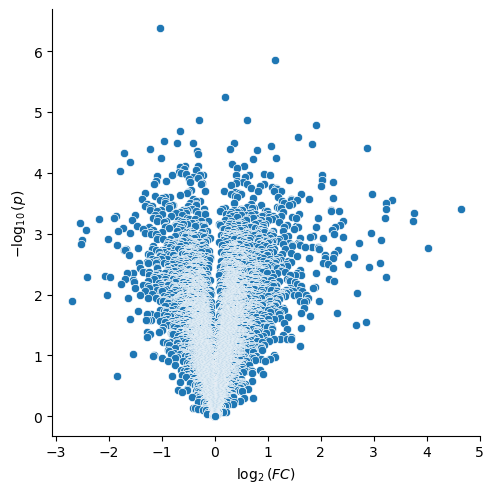
Before going further, we check that the four glucocorticoid-receptor target genes are up-regulated by dexamethasone.
qvalues.loc[["FKBP5", "PER1", "TSC22D3", "DUSP1"]]All four are up by roughly a factor of 8–16 with values around 1%. The experiment worked.
Note also how modest the values are. With four pairs the statistic rests on three degrees of freedom, so even a large change that is fairly consistent across the donors cannot be declared significant with much confidence: the smallest value in this experiment is about , and only some two hundred genes reach a value below 10-2. That is a property of the sample size rather than of the effect sizes, and it is why the thresholds we use below are far less stringent than they would be for a cohort of hundreds of patients.
Over-representation analysis
We use the gseapy module to run an overrepresentation analysis. gseapy can run the test locally if we give it the gene sets themselves, but when we name one of the gene-set libraries of the Enrichr web server, as we do here, it sends our gene list and background to Enrichr, which performs the test.
In the analysis here we use the KEGG database’s definition of biological pathways. This choice can easily be changed to other databases such as GO.
As input we use the genes with values below 0.01. The background is the set of genes we actually measured, not all human genes – a pathway can only be over-represented relative to what could have been detected.
import gseapy as gp

pathway_db=['KEGG_2019_Human']
background=set(qvalues.index)
gene_list = list(qvalues.loc[qvalues["q"]<0.01,"q"].index)

enr=gp.enrichr(
                gene_list=gene_list,
                gene_sets=pathway_db,
                background=background,
                outdir = None
)len(gene_list)219We keep only the values and term names, correct for multiple hypothesis testing, and list the terms with an FDR less than 20%. Enrichr only reports pathways that share at least one gene with our list, so the pathways with are missing from the input to the correction; this biases the estimate of downwards and makes the values somewhat optimistic.
kegg_enr = enr.results[["P-value","Term"]].rename(columns={"P-value": "p"})
np.random.seed(0)
kegg_enr = qvalue.qvalues(kegg_enr)
kegg_enr.loc[kegg_enr["q"]<0.20]The analysis seems to find overrepresentation of relatively few pathways, given how convincing the differential expression was. The strongest term, Mineral absorption, is driven by the metallothioneins MT2A, MT1X and MT1E, which are indeed classically induced by glucocorticoids, together with the metalloreductases STEAP1 and STEAP2 – but it is a somewhat oblique way of describing a drug response, and nothing that we would call a glucocorticoid pathway comes out at all.
enr.results.sort_values("P-value").head(5)[["Term", "P-value", "Genes"]]This is the characteristic failure mode of ORA. The 200-odd genes that pass the threshold are a thin slice of a response in which thousands of genes shift a little, and by cutting at we threw away all the information about how much each gene moved and in which direction.
Gene set enrichment analysis
We now use gseapy to run a gene set enrichment analysis (GSEA) on the whole ranked list instead of a thresholded one. This time we compare to the hallmark collection of MSigDB, fifty carefully curated sets that each summarize a coherent biological state.
We put the dexamethasone samples first so that a positive enrichment score means “up in dexamethasone”.
classes = ["Dex" if sample_name.startswith("Dex") else "Untreated" for sample_name in airway.columns]
gs = gp.GSEA(data=airway,
                 gene_sets='MSigDB_Hallmark_2020',
                 classes=classes,
                 permutation_type='phenotype', # null from permutations of class labels
                 permutation_num=1000, # number of permutations in the null distribution
                 min_size=15, # minimal size of pathway
                 outdir=None,  # do not write output to disk
                 no_plot=True, # Skip plotting
                 method='signal_to_noise',
                 threads=4, # Number of allowed parallel processes
                 seed=42)
gs.run()
gs.res2d[["Term","ES","NES","NOM p-val","FDR q-val"]].head(8)Why the permutation null matters here
Look closely at the nominal values: several of them cluster tightly just above 0.016, and none falls below it. That is not a coincidence. Permuting the phenotype labels of eight samples into two groups of four can produce at most distinct assignments, of which only 35 are distinct up to swapping the group names. The permutation value can therefore not be resolved beyond roughly , no matter how many permutations we ask for, and the FDR estimates inherit that coarseness. Strictly, our design is paired, and permutations that respect the pairing can only swap the labels within each donor, which gives just assignments and an even coarser resolution.
With very few samples per group (the usual rule of thumb is fewer than seven), phenotype permutation runs out of resolution, and the recommended fallback is to permute the gene sets instead: the ranked list is kept fixed and random gene sets of the same size are drawn to build the null. This is a weaker null: unlike phenotype permutation, it treats genes as independent and so tends to be anti-conservative for sets of co-regulated genes, but it is the only one with enough resolution here.
gs = gp.GSEA(data=airway,
                 gene_sets='MSigDB_Hallmark_2020',
                 classes=classes,
                 permutation_type='gene_set', # null from permutations of the gene sets
                 permutation_num=1000,
                 min_size=15,
                 outdir=None,
                 no_plot=True,
                 method='signal_to_noise',
                 threads=4,
                 seed=42)
gs.run()
gs_res = gs.res2d
We list the pathways with an FDR below 0.25, the threshold conventionally used for GSEA.
significant = gs_res[gs_res["FDR q-val"].astype(float)<0.25]
significant[["Term","ES","NES","NOM p-val","FDR q-val"]]Where ORA found almost nothing, GSEA reports about twenty hallmark sets, all of them up in dexamethasone. Two of the strongest are exactly the positive controls we hoped for, although they are not labeled the way a pharmacologist would label them:
Adipogenesis is a glucocorticoid signature in disguise. Dexamethasone is a standard ingredient of the cocktail used to drive adipocyte differentiation in culture, so the hallmark set is populated with genes that the glucocorticoid receptor induces directly.
Androgen Response is a steroid-receptor set, and the nuclear receptors share a large part of their target repertoire; FKBP5 sits in its leading edge.
Reading the leading edge, and reading the label
The second hit, TNF-alpha Signaling via NF-kB, deserves a closer look, because at face value it says the opposite of what one expects from an anti-inflammatory drug. Inspecting its leading edge explains the discrepancy.
term = "TNF-alpha Signaling via NF-kB"
lead = gs_res.loc[gs_res.Term == term, "Lead_genes"].iloc[0].split(";")
lead
['PER1',
'ATF3',
'NR4A1',
'IRS2',
'KLF9',
'DUSP1',
'PDLIM5',
'DUSP5',
'GADD45B',
'MAP3K8',
'FJX1',
'MAFF',
'ZBTB10',
'DNAJB4',
'FUT4',
'GFPT2',
'PTX3',
'TNFAIP3',
'INHBA',
'TIPARP',
'CFLAR',
'PHLDA2',
'RCAN1',
'SERPINB8',
'CEBPD',
'NFIL3',
'KLF6',
'NAMPT',
'TSC22D1',
'MYC',
'RHOB',
'MAP2K3',
'NFKBIA',
'STAT5A',
'SAT1',
'TGIF1',
'TRAF1']These are not markers of an activated inflammatory program. PER1, DUSP1 and KLF9 are well-known direct targets of the glucocorticoid receptor, ATF3 and NR4A1 are immediate-early genes that respond rapidly to many stimuli, and further down the list TNFAIP3 (A20) and NFKBIA () are inhibitors of NF-B whose induction is one of the mechanisms by which glucocorticoids shut the pathway down. The gene set is named after the stimulus used to define it, not after the direction of regulation, and a set can be enriched because its brake was applied just as easily as because its accelerator was.
The cells here were never challenged with a cytokine, so there was no inflammatory tone to suppress; consistently, the Inflammatory Response hallmark itself is flat.
gs_res.loc[gs_res.Term.isin(["Inflammatory Response",
                             "Interferon Gamma Response"]),
["Term","NES","NOM p-val","FDR q-val"]]The enrichment score tells you that a coherent group of genes moved together; it takes the leading edge to tell you which genes did it, and hence what the hit means biologically.
Visualizing the enrichment
gseapy has built-in routines for plotting the enrichment of a pathway.
axs = gs.plot(terms=gs_res.Term[0])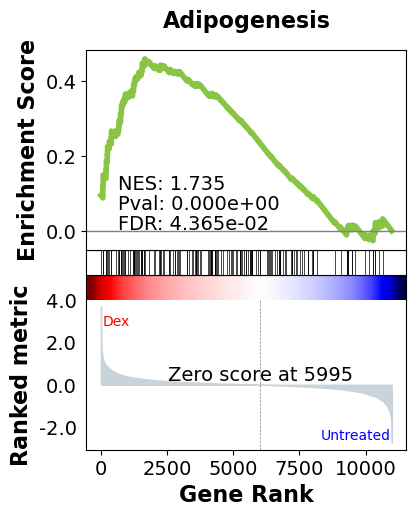
We can also compare the enrichment of several pathways in one plot.
axs = gs.plot(list(significant.Term[:5]), show_ranking=False, legend_kws={'loc': (1.05, 0)}, )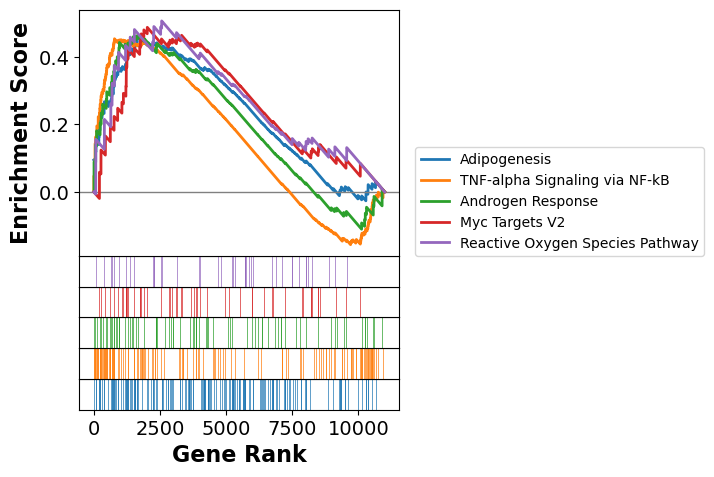
A heatmap shows the normalized expression of the genes in a pathway, here the first 25 leading-edge genes of Adipogenesis, in each sample. The four columns on the left are the dexamethasone-treated cultures and the four on the right the untreated ones; the clean split of the leading-edge genes into two blocks is what the enrichment score is measuring.
from gseapy import heatmap
# plotting heatmap
i = 0
genes = gs_res.Lead_genes[i].split(";")[:25]
ax = heatmap(df = gs.heatmat.loc[genes], z_score=0, title=gs_res.Term[i], figsize=(14,4))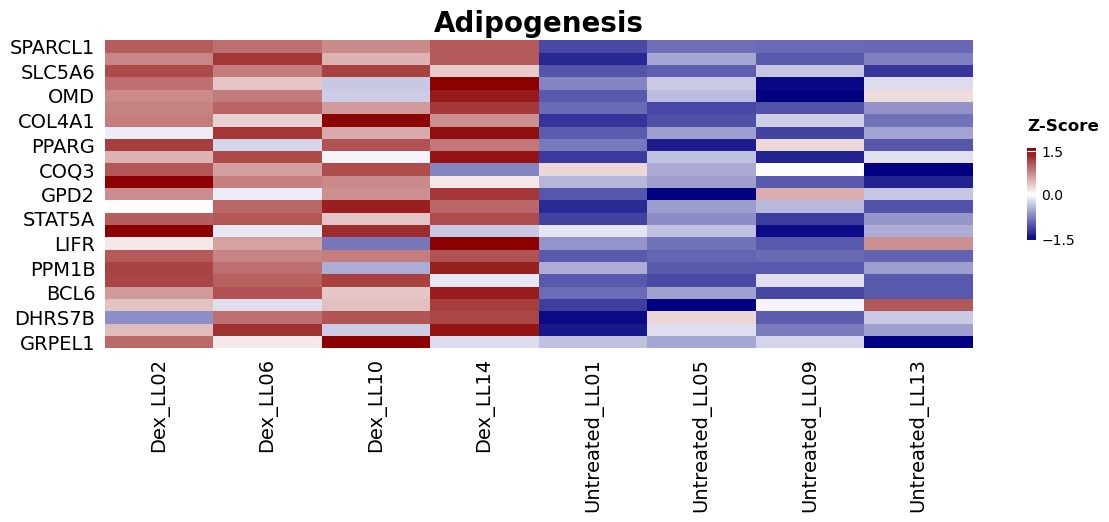
What you should know after reading this chapter
You should be able to:
Explain why a paired -test is used when each donor contributes one treated and one untreated sample, and how known glucocorticoid-receptor targets such as FKBP5 serve as a positive control.
Explain why ORA with a cut-off found few pathways in the dexamethasone data while GSEA found many, in terms of the information about size and direction of change that the threshold throws away.
Calculate how many distinct ways the phenotype labels of a small experiment can be permuted, such as for four against four samples, and explain how this limits the permutation value. Explain why gene-set permutation is then used, and why it tends to be anti-conservative.
Interpret a GSEA hit through its leading-edge genes, and explain how a gene set named after a stimulus, such as TNF-alpha Signaling via NF-kB, can come out enriched because inhibitors of that pathway are induced.
- Himes, B. E., Jiang, X., Wagner, P., Hu, R., Wang, Q., Klanderman, B., Whitaker, R. M., Duan, Q., Lasky-Su, J., Nikolos, C., Jester, W., Johnson, M., Panettieri, R. A., Tantisira, K. G., Weiss, S. T., & Lu, Q. (2014). RNA-Seq Transcriptome Profiling Identifies CRISPLD2 as a Glucocorticoid Responsive Gene that Modulates Cytokine Function in Airway Smooth Muscle Cells. PLoS ONE, 9(6), e99625. 10.1371/journal.pone.0099625