


Introduction
In high-throughput biology, analysis often involves testing a large number of hypotheses simultaneously. This is common in fields like genomics, transcriptomics, and proteomics, where experiments might involve thousands of genes or proteins being tested for associations with a condition or trait. When many tests are conducted, even a small chance of error for each test accumulates into a substantial number of false discoveries. Crucially, a single value can no longer be interpreted in isolation—its meaning depends on the size of the full hypothesis set and on how many results are declared significant.
To understand this, imagine testing 1,000 hypotheses with a significance threshold () of 0.05. If the null hypothesis is true for all these tests, we would still expect about 5% of them, or 50 tests, to be significant simply by chance. A realistic report therefore needs to communicate both numbers: how many hypotheses were tested and how many were called significant. Only then can we judge whether the significant subset looks plausible or if it is essentially the handful of false positives that we inevitably expect among thousands of null tests.
Multiple hypothesis corrections control an error rate defined over the whole list of significant findings. The two most common ones are the Family-Wise Error Rate (FWER), the probability that the list contains at least one false positive, and the False Discovery Rate (FDR), the expected proportion of false positives in the list.
Bonferroni Correction
The Bonferroni correction is one of the simplest and most conservative methods for controlling the FWER. It works as follows:
Given a significance level , divide it by the number of hypotheses being tested to obtain the adjusted significance level:
Call a hypothesis significant if its value is less than .
This keeps the probability of making at least one false positive across all the tests below . The price is that with a large number of hypotheses the adjusted threshold becomes so small that many true effects are missed, i.e. the procedure loses statistical power.
Calculating the Upper Bound of the False Discovery Rate with the Benjamini-Hochberg Procedure
The Benjamini-Hochberg (BH) procedure is a popular method for controlling the False Discovery Rate (FDR), which is the expected proportion of nulls among the values below threshold, i.e. the fraction of false positives among the values we call significant. Unlike the Bonferroni correction, which limits the probability of making even a single false positive, the BH procedure accepts a controlled fraction of false positives in exchange for detecting more of the true effects.
The procedure works as follows:
Rank all the values such that , where is the total number of hypotheses.
Choose a desired FDR level, denoted as .
For each value , calculate the threshold value
where is the rank of the value.
Find the largest for which . Reject the null hypotheses of all tests with values less than or equal to , i.e. declare those features significant. (If no such exists, nothing is declared significant.)
The BH procedure guarantees an FDR of at most when the tests are independent, and more generally under positive regression dependence; under arbitrary dependence the threshold has to be divided by . More precisely, BH controls the FDR at rather than at , where is the unknown proportion of true null hypotheses, so it is conservative when many of the hypotheses are truly alternative. That is exactly the slack the procedure described next recovers.
Calculating values with Storey’s Method
Storey introduced an alternative to the Benjamini-Hochberg procedure for controlling the FDR, known as the value approach. The value is the FDR analogue of the value: just as the value of a feature is the smallest significance level at which that feature would be called significant, its value is the smallest false discovery rate at which it would be called significant, . Note that this is a minimum over all thresholds at least as large as , and not simply the estimated FDR evaluated at ; since is not monotone in , the two can differ.
Both Storey’s method and the Benjamini-Hochberg procedure view the observed values as a mixture of two groups: values from true null hypotheses (), which are uniformly distributed between 0 and 1, and values from true alternative hypotheses (), which tend to be small. The Benjamini-Hochberg procedure in effect assumes that all hypotheses are null when it counts the expected false positives, while Storey’s method estimates the fraction of the values that stem from true null hypotheses.
Storey’s procedure counts the features considered significant as the values below a threshold . The number of nulls below this threshold is estimated as , where is the estimated fraction of null hypotheses, is the total number of hypotheses, and is the chosen threshold. This is possible because we expect nulls, uniformly distributed between 0 and 1, and a fraction of them to fall below the threshold.
The proportion of null statistics is estimated by a procedure of its own. If all hypotheses were null, we would expect approximately values above a threshold . Alternative values rarely end up above , so the number of values above , divided by , estimates . As approaches 1, this estimate contains fewer alternative values but the estimate also becomes more variable, so a smoothing function (spline) is applied to stabilize the estimate by evaluating it at .
Here is how Storey’s value procedure works, as described by Storey & Tibshirani:
Order the values: Let be the ordered values. Lower values indicate stronger evidence against the null hypothesis.
Estimate for a range of values:
For a range of values, such as , calculate the proportion of values greater than :
where represents the count of values greater than , and is the total number of hypotheses.
Fit a natural cubic spline to estimate :
Let be a natural cubic spline with three degrees of freedom, fitted to as a function of . The final estimate of is given by evaluating the spline at :
A spline is a smooth curve made of polynomial pieces. With only three degrees of freedom the spline does not pass through every ; it smooths out their random fluctuations, which are largest for close to 1.
Estimate the FDR for each value:
Estimate the FDR for a threshold at each ordered value, as the estimated number of significant null statistics, , divided by the number of values below or at the threshold, .
Ensure monotonicity:
Assign
For , update the values to ensure they are monotonically increasing:
This way a larger value never receives a smaller value.
If we set , Storey’s procedure calls exactly the same features significant at an FDR level as the Benjamini-Hochberg procedure. As long as , Storey’s method is therefore never more conservative than Benjamini-Hochberg, and it gains the most power when many hypotheses are truly alternative, i.e. when is well below one.
Illustration: true and false positives in a value histogram
Below we simulate values for 1,000 hypotheses, half of which are nulls (no effect) and half alternative hypotheses (a true effect).
Notebook Cell
# When the page runs in the browser (JupyterLite), seaborn is not preinstalled, so we install it first
import sys
if sys.platform == "emscripten":
    import micropip
    await micropip.install("seaborn")
Source
import numpy as np
import seaborn as sns
import matplotlib.pyplot as plt

# Parameters
rng = np.random.default_rng(42)
m = 1000  # Number of hypotheses
true_null_proportion = 0.5  # Proportion of null hypotheses

true_nulls = int(m * true_null_proportion)
alternative = m - true_nulls

# Generate p-values from uniform distribution for nulls
p_values_null = rng.uniform(0, 1, true_nulls)

# Generate p-values from a Beta distribution for false nulls (to represent true effects)
p_values_effect = rng.beta(1.0, 5.0, alternative)  # Just for illustration

# Combine p-values
p_values = np.concatenate([p_values_null, p_values_effect])

# Plot the p value distribution
sns.set(style="whitegrid", context="talk")
plt.figure(figsize=(14, 6))
sns.histplot(p_values, bins=50, kde=False, color='gray', alpha=0.5, label='$p$ values')
plt.axvline(x=0.1, color='r', linestyle='--', label='Significance Threshold')
plt.axhline(y=true_nulls / 50, color='b', linestyle='--', label='Expected Level of Nulls')

# Add text for TP, FP, FN, TN
plt.text(0.05, plt.ylim()[1] * 0.2, 'TP', color='green', fontsize=20, horizontalalignment='center')
plt.text(0.05, plt.ylim()[1] * 0.05, 'FP', color='red', fontsize=20, horizontalalignment='center')
plt.text(0.15, plt.ylim()[1] * 0.2, 'FN', color='blue', fontsize=20, horizontalalignment='center')
plt.text(0.15, plt.ylim()[1] * 0.05, 'TN', color='purple', fontsize=20, horizontalalignment='center')

plt.xlabel('$p$ value')
plt.ylabel('Frequency')
plt.xlim(0., 1.)
plt.legend()
plt.show()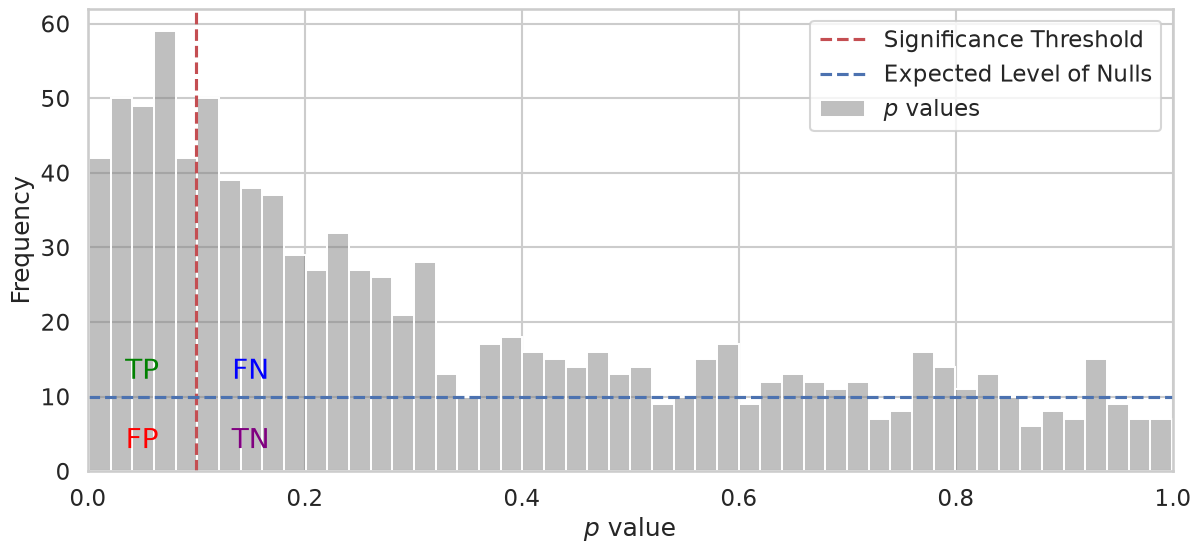
The values of the nulls are uniformly distributed between 0 and 1, which gives the flat part of the histogram. This follows from the way a value is constructed: if the test statistic has a continuous cumulative distribution under the null, then , and applying a distribution function to its own random variable always yields a uniform variable, so for every in whatever the shape of . The values of the alternative hypotheses are concentrated near zero, as data generated with a true effect are unlikely under the null hypothesis.
True and false positives
The vertical red line marks a significance threshold: hypotheses with values at or below it are called significant, those above it not significant. The dashed blue line marks the expected height of the histogram for the null values alone. Together, the two lines divide the hypotheses into four groups:
TP (True Positives): alternative hypotheses below the threshold, i.e. real effects that we correctly identify.
FP (False Positives): null hypotheses that end up below the threshold due to random variation.
FN (False Negatives): alternative hypotheses above the threshold, i.e. true effects that we fail to detect. A high number of FNs means that our test lacks sensitivity.
TN (True Negatives): null hypotheses above the threshold.
The FDR, the expected proportion of false positives among all hypotheses called significant, is then approximately
Moving the threshold trades sensitivity, the fraction of the true effects that we detect, against precision, , the fraction of our findings that are real.
What you should know after reading this chapter
You should be able to:
Explain why testing thousands of hypotheses at a fixed produces many false positives, and calculate how many to expect when all hypotheses are null.
Define the family-wise error rate (FWER) and the false discovery rate (FDR), , and contrast what controlling each of them promises about a list of significant findings.
Calculate the Bonferroni threshold , and explain why it loses statistical power when is large.
Calculate which hypotheses the Benjamini-Hochberg procedure declares significant for a short list of values and an FDR level , and explain why it is conservative when is well below one.
Explain why values are uniformly distributed under and concentrated near zero under , and identify the true positives, false positives, true negatives and false negatives in a value histogram with a threshold.
Calculate for a given , and explain the trade-off in choosing : a large leaves fewer alternative values above it, but gives a more variable estimate.
Define the value as the smallest FDR at which a feature is called significant, and calculate values for a short sorted list of values from , including the step that makes them monotone.
- Storey, J. D. (2002). A Direct Approach to False Discovery Rates. Journal of the Royal Statistical Society Series B: Statistical Methodology, 64(3), 479–498. 10.1111/1467-9868.00346