


In regression, we typically aim to predict a continuous outcome (like a numerical value). However, we can extend the same concepts of regression to classification tasks, where the goal is to predict a discrete class label. By using specific target values (like ), we can transform regression into a method for classifying data.
The Concept of Classification with Regression
In classification, the target variable represents the class label. Common encodings for binary classification are signed labels (), indicator labels (), or boolean labels ().
In this chapter, we’ll primarily use the signed labels , but we’ll note where conversions are necessary.
Classification Loss Functions
When applying regression techniques to classification, the choice of loss function is critical. In regression, we typically minimize the sum of squared residuals, but in classification, we use loss functions that are designed to penalize misclassifications proportional to how much the predictor insists on the incorrect prediction. Below are three common loss functions used in classification tasks:
Hinge Loss (Used in Support Vector Machines)
The hinge loss is commonly used in support vector machines (SVMs), which we meet in a later chapter. It assumes signed labels and is defined as:
This loss penalizes any data points where the predicted value does not match the true label with a sufficient margin. If , the prediction is correct with a margin and there is no penalty. If , there is a penalty proportional to . This means that misclassified points are penalized, but so are correctly classified points that lie too close to the decision boundary ().
Notebook Cell
# When the page runs in the browser (JupyterLite), seaborn is not preinstalled, so we install it first
import sys
if sys.platform == "emscripten":
    import micropip
    await micropip.install("seaborn")
Source
import numpy as np
import matplotlib.pyplot as plt

# Predicted values f(x) from -3 to +3
f_x = np.linspace(-3, 3, 200)

# Hinge loss for y=+1 and y=-1
hinge_loss_y1 = np.maximum(0, 1 - f_x)  # Hinge loss for y=+1
hinge_loss_yneg1 = np.maximum(0, 1 + f_x)  # Hinge loss for y=-1

# Plot the hinge loss for both labels
plt.figure(figsize=(10, 6))
plt.plot(f_x, hinge_loss_y1, label="Hinge Loss (y=+1)", linestyle='-', linewidth=2)
plt.plot(f_x, hinge_loss_yneg1, label="Hinge Loss (y=-1)", linestyle='--', linewidth=2)
plt.xlabel("Predicted Value $f(\\mathbf{x})$")
plt.ylabel("Hinge Loss")
plt.legend()
plt.grid(True)
plt.show()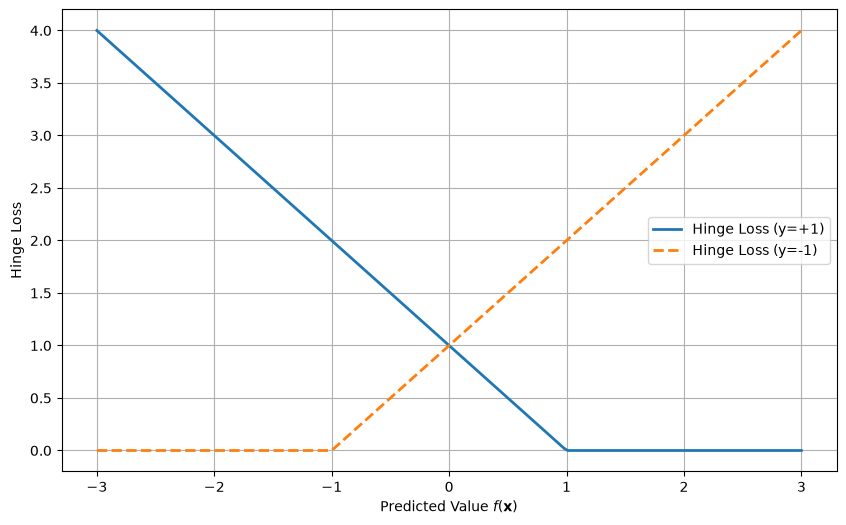
Logistic Loss (Used in Logistic Regression)
The logistic loss is used in logistic regression and is defined as:
This loss function provides a smooth gradient and penalizes incorrect predictions by increasing the loss for large errors. The form above assumes signed labels and treats as a real-valued score.
Source
import numpy as np
import matplotlib.pyplot as plt

# Predicted values f(x) from -3 to +3
f_x = np.linspace(-3, 3, 200)

# Logistic loss for y=+1 and y=-1
logistic_loss_y1 = np.log(1 + np.exp(-f_x))  # Logistic loss for y=+1 (signed labels)
logistic_loss_yneg1 = np.log(1 + np.exp(f_x))   # Logistic loss for y=-1 (signed labels)

# Plot the logistic loss for both labels
plt.figure(figsize=(10, 6))
plt.plot(f_x, logistic_loss_y1, label="Logistic Loss (y=+1)", linestyle='-', linewidth=2)
plt.plot(f_x, logistic_loss_yneg1, label="Logistic Loss (y=-1)", linestyle='--', linewidth=2)
plt.xlabel("Predicted Value $f(\\mathbf{x})$")
plt.ylabel("Logistic Loss")
plt.legend()
plt.grid(True)
plt.show()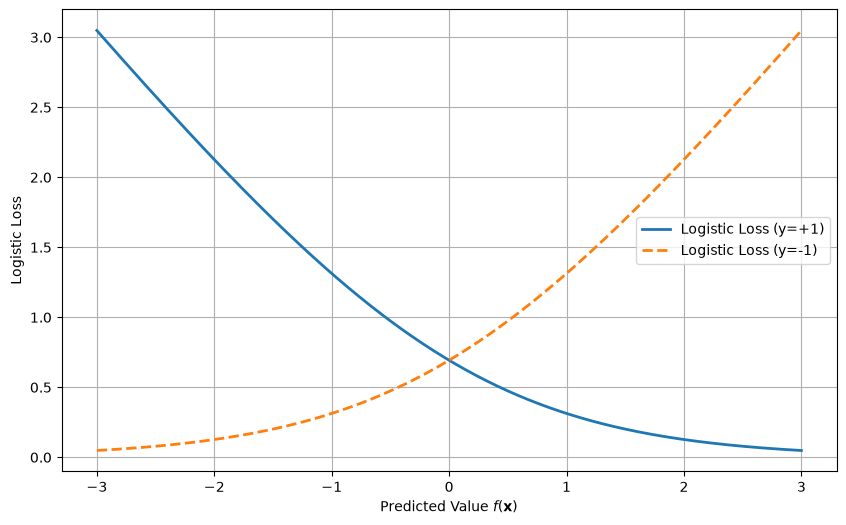
Cross-entropy loss
Probably the most used loss function for classification tasks is cross-entropy loss. Here we use indicator labels, , and instead of a real-valued score the model outputs a predicted probability . The loss measures the difference between the predicted probabilities and the actual class labels. It is defined as:
For the mathematically inclined reader, this is the negative log-likelihood of a Bernoulli model, so minimizing it corresponds to maximum likelihood estimation for probabilistic predictions. If is computed from a score with the sigmoid function introduced below, the cross-entropy is exactly the logistic loss above, only written for 0/1 instead of ±1 labels.
Source
import numpy as np
import matplotlib.pyplot as plt

# Predicted probabilities p from near zero to near one, to avoid log(0)
p = np.linspace(0.01, 0.99, 100)

# Compute cross-entropy loss for y=1 and y=0
loss_y1 = -np.log(p)  # Cross-entropy loss when y=1
loss_y0 = -np.log(1 - p)  # Cross-entropy loss when y=0

# Plot the cross-entropy loss for y=1 and y=0
plt.figure(figsize=(10, 6))
plt.plot(p, loss_y1, label="Cross-Entropy Loss (y=1)", linestyle='-', linewidth=2)
plt.plot(p, loss_y0, label="Cross-Entropy Loss (y=0)", linestyle='--', linewidth=2)
plt.xlabel("Predicted Probability $p$")
plt.ylabel("Cross-Entropy Loss")
plt.legend()
plt.grid(True)
plt.show()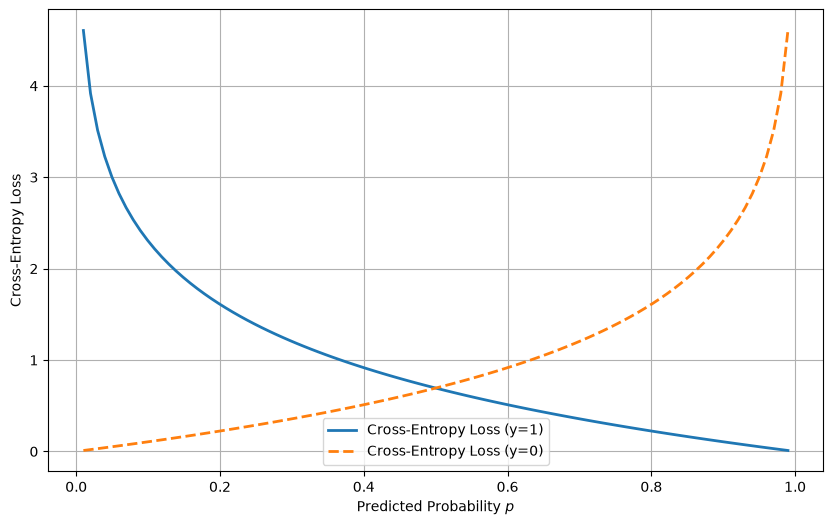
Classification Example: Logistic Regression
In logistic regression, we model the probability that a data point belongs to class +1 rather than class -1.
The logistic function, also called the sigmoid function, is used to map the output of the linear function to a probability between 0 and 1:
Where is the linear function whose parameters we optimize, and includes a constant 1 for the intercept, as in the regression chapter. The logistic loss function is then minimized to find the best-fitting model.
Optimizing the Model for Classification
To solve the classification task, we follow the same procedure used in regression:
Define a loss function: For classification, this could be the hinge loss or logistic loss.
Optimize the loss function: We minimize the loss function with an optimizer, such as gradient descent.
Make predictions: After fitting the model, we predict the class label based on the sign of .
Example of Logistic Regression in Code
import numpy as np
import seaborn as sns
import matplotlib.pyplot as plt
from scipy.optimize import minimize

sns.set_style("whitegrid")

# Generate a simple dataset from two separate distributions
np.random.seed(0)

# Class +1 examples: centered at (0.5, 0.5)
X_pos = np.random.randn(50, 2) + 0.5
y_pos = np.ones(50)

# Class -1 examples: centered at (-0.5, -0.5)
X_neg = np.random.randn(50, 2) - 0.5
y_neg = -np.ones(50)

# Combine the datasets
y = np.hstack([y_pos, y_neg])
X = np.vstack([X_pos, X_neg])
X = np.hstack([X, np.ones((X.shape[0], 1))])  # Add intercept term

# Sigmoid function
def sigmoid(z):
    return 1 / (1 + np.exp(-z))

# Logistic loss function
def logistic_loss(beta, X, y):
    z = X @ beta
    return np.sum(np.log(1 + np.exp(-y * z)))

# Initial guess for beta (weights)
initial_beta = np.zeros(X.shape[1])

# Minimize the logistic loss
result = minimize(logistic_loss, initial_beta, args=(X, y), method='BFGS')
optimized_beta = result.x

# Generate a grid of values for plotting the decision boundary
x1_range = np.linspace(X[:, 0].min() - 1, X[:, 0].max() + 1, 100)
x2_range = np.linspace(X[:, 1].min() - 1, X[:, 1].max() + 1, 100)
x1_grid, x2_grid = np.meshgrid(x1_range, x2_range)

# Compute the logistic regression decision boundary (p = 0.5)
z = optimized_beta[0] * x1_grid + optimized_beta[1] * x2_grid + optimized_beta[2]
probability = sigmoid(z)

# Create a plot with the data points and decision boundary
plt.figure(figsize=(8, 6))

# Plot the probability gradient
contour_plot = plt.contourf(x1_grid, x2_grid, probability, levels=50, cmap='coolwarm', alpha=0.7)

# Scatter plot of the dataset with class labels
sns.scatterplot(x=X[:, 0], y=X[:, 1], hue=y, palette="coolwarm", s=60, edgecolor='k')


# Add the decision boundary (p = 0.5)
plt.contour(x1_grid, x2_grid, probability, levels=[0.5], colors='black', linestyles='--')

plt.xlabel("Feature 1")
plt.ylabel("Feature 2")
plt.grid(True)
# Add colorbar showing the predicted probability
plt.colorbar(contour_plot, label="Predicted Probability (Class +1)")

plt.show()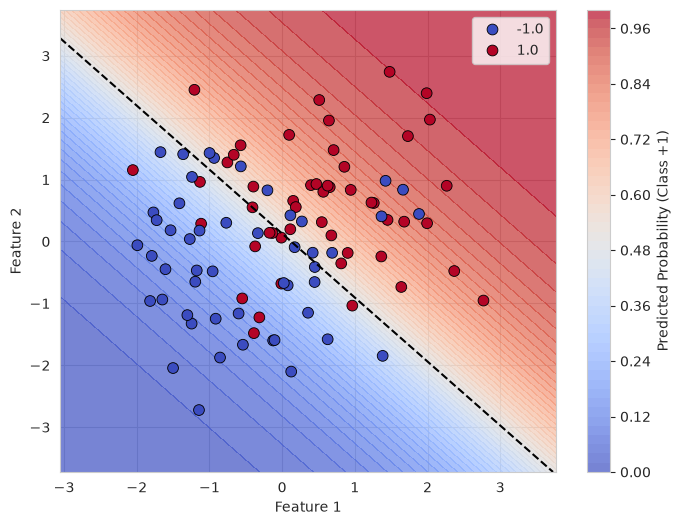
The shading shows the predicted probability of class +1. The dashed line is the decision boundary, where and the probability is 0.5; points on either side are assigned the class given by the sign of .
What you should know after reading this chapter
You should be able to:
Explain how regression can be used for classification by encoding the classes as signed labels or indicator labels , and predicting the class from the sign of , or, for a predicted probability, from whether it exceeds 0.5.
Write down the hinge loss, the logistic loss and the cross-entropy loss, state which label encoding each one assumes, and calculate each loss by hand for a single data point.
Interpret plots of the hinge and logistic losses against for and . Explain why both losses grow for predictions on the wrong side, and why the hinge loss is exactly zero once .
Explain how logistic regression uses the sigmoid function to turn the linear function into the probability , and calculate this probability for a given value of .
Interpret a plot of the predicted probability over the feature space, and identify the decision boundary as the points where , that is, where the probability is 0.5.